Systematic Risk Management in Trading: A Complete Guide

Systematic risk management in trading is a rule-based, mathematical framework that controls risk across every trade and portfolio position by automating entry, exit, position sizing, and loss limits. The goal is to remove emotional bias from risk decisions entirely. Rather than relying on a trader’s judgment in the moment, systematic risk management encodes predefined rules into software that executes without hesitation, regardless of market conditions. Core controls typically include:
- Stop-loss orders at predefined price levels
- Position sizing formulas tied to account equity and volatility
- Maximum drawdown thresholds that trigger automatic trading halts
- Correlation limits preventing overexposure to related assets
- Portfolio-level sector caps to avoid concentration risk
The framework draws on standards like ISO 31000, which treats risk management as an iterative, organization-wide process, and aligns with professional guidance from quantitative finance practitioners who treat survivability, not just profit, as the primary objective.
Table of Contents
- What is systematic risk, and how does it differ from unsystematic risk?
- How traders measure and analyze systematic risk in practice
- Risk management techniques used inside systematic trading frameworks
- Practical steps for implementing systematic risk management in your trading
- Limitations and challenges you will face with systematic risk management
- Key Takeaways
What is systematic risk, and how does it differ from unsystematic risk?
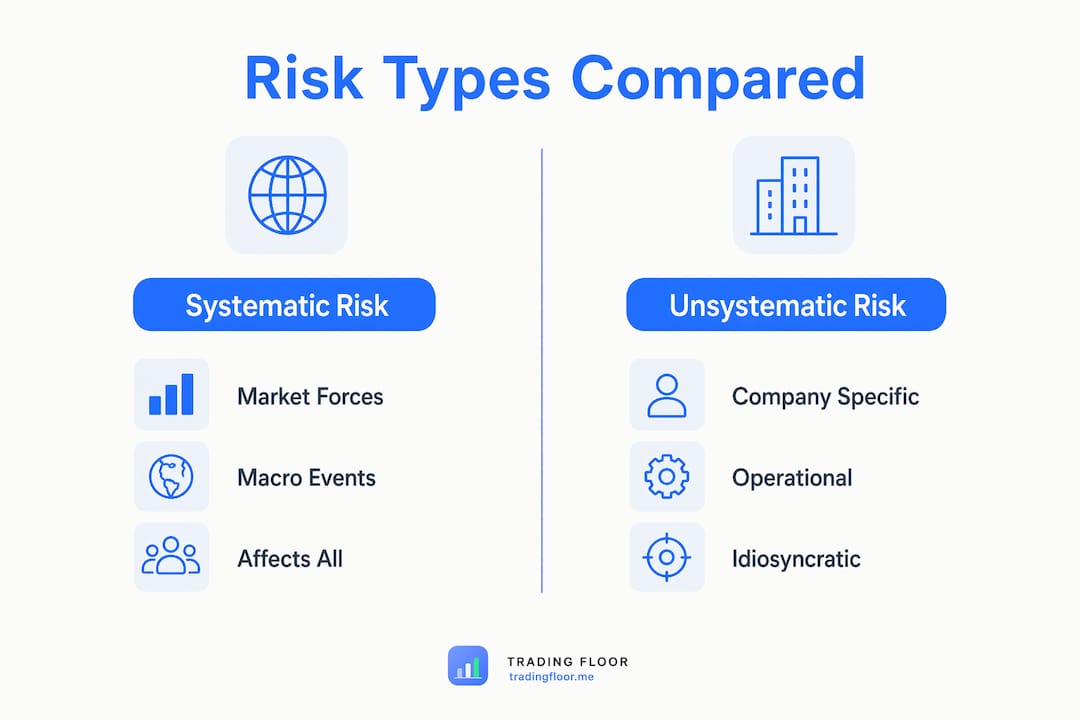
Understanding what you are actually managing matters before you build any framework around it. Systematic risk is market-wide risk. It affects all assets simultaneously and cannot be diversified away because it stems from macroeconomic forces: interest rate changes, recessions, geopolitical shocks, and broad market sell-offs. Diversification reduces only unsystematic risk, which is specific to individual companies or sectors.
| Feature | Systematic Risk | Unsystematic Risk |
|---|---|---|
| Source | Market-wide macroeconomic forces | Company or sector-specific factors |
| Examples | Recessions, rate hikes, geopolitical crises | Earnings misses, management scandals, supply chain failures |
| Diversifiable? | No | Yes |
| Measured by | Beta, VIX, correlation coefficients | Standard deviation of individual asset returns |
| Management approach | Stop-losses, hedges, drawdown limits, circuit breakers | Diversification, position limits |
One distinction worth clarifying: systematic risk and systemic risk are not the same thing. Systemic risk refers to the collapse of an entire financial system, like the 2008 banking crisis, where the failure of interconnected institutions cascades. Systematic risk is broader and more routine: it is the unavoidable exposure every market participant carries simply by being invested.
Beta is the standard metric for quantifying an asset’s sensitivity to systematic risk. A beta of 1.0 means the asset moves in lockstep with the market. A beta of 1.5 means it amplifies market moves by 50%. Traders use beta to calibrate how much systematic risk a given position adds to the portfolio, then size accordingly.
How traders measure and analyze systematic risk in practice
Concrete examples ground this quickly. The 2020 COVID crash, the 2022 Federal Reserve rate-hiking cycle, and the 2008 financial crisis are all textbook systematic risk events. Every asset class fell together. No amount of stock diversification protected a portfolio because the risk was in the market itself, not in any individual holding.
The metrics traders use to track and quantify this exposure include:
- Beta: Measures an asset’s price movement correlation relative to a benchmark index. Formula: Beta = Covariance(Asset, Market) / Variance(Market). A stock with a beta of 0.7 historically moves 70% as much as the index in either direction.
- VIX (CBOE Volatility Index): Tracks implied volatility in S&P 500 options, functioning as a real-time fear gauge. Spikes above 30 historically signal elevated systematic risk across equity markets.
- Correlation coefficients: When correlations across a portfolio’s holdings converge toward 1.0 during stress, diversification collapses. Monitoring rolling correlations between positions is a leading indicator of hidden systematic exposure.
- Risk premium: The excess return investors demand for bearing systematic risk. In the Capital Asset Pricing Model (CAPM), expected return = Risk-Free Rate + Beta × (Market Return − Risk-Free Rate). Higher beta assets carry higher required premiums precisely because they amplify systematic risk.
Pro Tip: Monitor rolling 30-day correlations across your portfolio during high-VIX environments. When assets that normally move independently start moving together, your effective diversification has collapsed and your systematic exposure has grown far beyond what your position sizing assumed.
These metrics feed directly into portfolio optimization. A trader running a trend-following system might cap the portfolio’s weighted average beta at 0.8 to limit systematic exposure, then use VIX levels to scale position sizes down when implied volatility spikes.

Risk management techniques used inside systematic trading frameworks
Systematic trading employs methodical rules that define trading goals and risk controls, covering everything from trend-following entries to passive index tracking, all validated through backtesting. The risk management layer within these systems operates on two levels.
Endogenous risk controls live inside the trading model itself. They include the stop-loss logic, position sizing algorithms, and exit rules that are part of the strategy’s core code. Exogenous risk controls sit outside the model and act as a second layer of protection. Systematic traders code both to ensure comprehensive control: the model handles trade-level risk, while the external layer enforces portfolio-level limits that no single strategy can override.
The four primary risk mitigation techniques applied within these frameworks are:
- Avoidance: Refusing to trade certain instruments or during certain market conditions (e.g., avoiding low-liquidity assets or holding no positions during major economic announcements).
- Reduction: Stop-loss placement, position sizing limits, and drawdown controls that cap the magnitude of any loss.
- Transfer: Hedging through options, futures, or inverse ETFs to shift systematic risk exposure to a counterparty.
- Acceptance: Acknowledging residual risk that cannot be eliminated and sizing positions so that worst-case outcomes remain survivable.
Position sizing deserves particular emphasis. It is mathematically more impactful on long-term trading survival than entry timing. A common starting point is the 1% rule: never risk more than 1% of total account capital on a single trade. Risk managers commonly apply the 1% rule, limiting potential loss on any single trade to a small fraction of total account capital to maintain consistent risk control.
A critical principle from practitioners: risk managers who rely on human judgment undermine the consistency that makes systematic trading work. Automation with minimal human intervention is not a convenience. It is the mechanism that keeps the framework intact when markets move fast and emotions run high.

Practical steps for implementing systematic risk management in your trading
Turning theory into a working system requires a specific sequence. Here is how professional systematic traders structure it:
-
Define your risk parameters before writing a single entry rule. Set the maximum loss per trade (typically 1%–2% of equity), the maximum portfolio drawdown you will tolerate before stopping all trading, and the maximum number of correlated positions you will hold simultaneously.
-
Set stop-loss and take-profit levels algorithmically. Stop-loss placement should be based on technical structure (support levels, ATR multiples) rather than arbitrary dollar amounts. Moving averages, particularly the 20-, 50-, and 200-day, are widely used reference points for setting these levels systematically.
-
Calculate position size from your risk parameters, not from conviction. Position size = (Account Equity × Risk Per Trade %) / (Entry Price − Stop-Loss Price). This formula keeps every trade’s dollar risk constant regardless of price or volatility.
-
Build portfolio-level circuit breakers. These are automated rules that halt all new trading once equity drawdown crosses a predefined threshold. The specific threshold should be calibrated to your strategy’s historical drawdown profile during backtesting. For consistent trade sizing across accounts, this circuit-breaker logic needs to apply at the portfolio level, not just per trade.
-
Backtest against at least one full market cycle. Systematic risk management frameworks require continuous backtesting, stress testing, and automation to enforce rule adherence and adapt to changing market environments. A backtesting template built around your specific risk parameters accelerates this process significantly.
-
Stress test against adverse scenarios. Run your system through the 2008 financial crisis, the 2020 COVID crash, and the 2022 rate-hiking environment. If the drawdown in any scenario exceeds your predefined maximum, tighten the position sizing or add hedging rules before going live.
-
Automate execution to prevent discretionary overrides. The infrastructure of systematic trading is inseparable from its risk management rules. When a human can override a stop-loss “just this once,” the framework has already failed. Platforms that enforce account-level risk management rules automatically remove that temptation entirely.
-
Monitor market regime shifts continuously. A trend-following system calibrated for 2021’s low-volatility bull market will behave very differently in a high-volatility, mean-reverting environment. Systematic traders build regime-detection rules that adjust position sizing and correlation limits based on current VIX levels and rolling market returns.
-
Review and adapt, but never in the heat of a drawdown. Rule changes should happen during calm periods, based on systematic analysis of performance data, not during a losing streak when the instinct is to abandon the system entirely.
Survivability is the primary objective of systematic risk management. A system that loses 40% of its capital requires a 67% gain just to break even. Keeping maximum drawdown below 20% through predefined rules is not conservative — it is the prerequisite for compounding returns over time. The traders who survive long enough to benefit from their edge are the ones who never let a single bad period become catastrophic.
Tradingfloor’s real-time position synchronization across multiple funded and evaluation accounts is built around exactly this principle: individual risk controls apply per account, automated execution prevents manual overrides, and the system mirrors the leader’s net position without requiring the trader to manage each account separately. For prop traders running multiple accounts across platforms like Tradovate and TopstepX, that architecture is what makes systematic risk governance practical rather than theoretical.
Limitations and challenges you will face with systematic risk management
No framework eliminates systematic risk. It controls exposure to it. That distinction matters when markets behave in ways no historical dataset anticipated.
Overfitting is the most common failure mode. A system backtested on 10 years of data can be tuned to perform perfectly on that specific dataset while failing immediately in live trading. The fix is out-of-sample testing: reserve a portion of historical data that the system never sees during development, then validate performance on that unseen data before going live.
Model degradation happens as markets evolve. A momentum strategy that worked from 2010 to 2020 may underperform in a different rate environment. Systematic risk management requires periodic recalibration, not a set-it-and-forget-it mentality.
Correlation breakdown during crises is the deepest challenge. Assets that appear uncorrelated under normal conditions often move together during systematic risk events, precisely when diversification is most needed. Stress testing against historical crisis periods, as described above, is the only reliable way to anticipate this.
Execution risk in fast markets can cause slippage between the theoretical stop-loss price and the actual fill price. Liquid instruments and limit-order strategies reduce this gap, but it never disappears entirely.
For traders new to building these controls, risk management fundamentals provide a solid foundation before attempting to code complex portfolio-level rules.
Key Takeaways
Systematic risk management in trading works because it replaces judgment with rules, enforcing discipline at both the trade and portfolio level before market stress makes clear thinking impossible.
| Point | Details |
|---|---|
| Systematic risk cannot be diversified away | It stems from market-wide forces; only hedges, stop-losses, and drawdown limits control it. |
| Beta quantifies systematic exposure | Use it to calibrate position sizing and cap portfolio-level sensitivity to market moves. |
| Position sizing drives survival | Limiting risk to 1%–2% of equity per trade mathematically protects capital across losing streaks. |
| Automation prevents discretionary overrides | Encoding rules into software removes the human temptation to bypass controls during drawdowns. |
| Backtesting and stress testing are non-negotiable | Validate every risk framework against historical crisis periods before committing real capital. |
Recommended
- Account-Level Risk Management: A Trader’s Complete Guide — Trading Floor
- Automated Trading Performance Metrics: A Trader’s Guide — Trading Floor
- Trading Execution Best Practices: A 2026 Trader’s Guide — Trading Floor
- What Is a Master Trading Account? A 2026 Guide — Trading Floor
Trading Floor mirrors every trade across your Tradovate, TopstepX & Rithmic accounts in real time, from $25/mo.
Start copying →