Automated Trading Performance Metrics: A Trader's Guide

Automated trading performance metrics are numerical tools that evaluate how well an algorithmic trading system performs across profitability, risk, and consistency. Every serious trader running a bot or algorithm needs these indicators to separate genuine edge from statistical noise. Relying on a single number like win rate or raw return is the fastest way to misread a strategy’s true health. This guide covers the core metrics, what they measure, and how to read them together for a complete picture.
What are automated trading performance metrics?
Automated trading performance metrics are quantitative indicators used to assess the effectiveness, risk, and sustainability of algorithmic trading strategies. They fall into four categories: profitability metrics, risk metrics, risk-adjusted return metrics, and trade quality metrics. Each category answers a different question about your system. Profitability metrics tell you if the strategy makes money. Risk metrics tell you how much capital you could lose. Risk-adjusted metrics tell you if the returns are worth the risk. Trade quality metrics tell you if the system is executing as designed.
No single metric tells the full story. Relying on single metrics like win rate or raw return hides key risks that only surface when you examine profitability, risk, and trade diagnostics together. That combination is what separates traders who survive drawdowns from those who blow up accounts.

What are the core profitability metrics for trading systems?
Profit Factor is the ratio of gross profit to gross loss. A Profit Factor above 1.5 signals a solid strategy, while anything below 1.0 means the system loses money regardless of how often it wins. That threshold matters because a Profit Factor of 1.2 might look acceptable until you account for commissions and slippage, which can push it below 1.0 in live conditions.
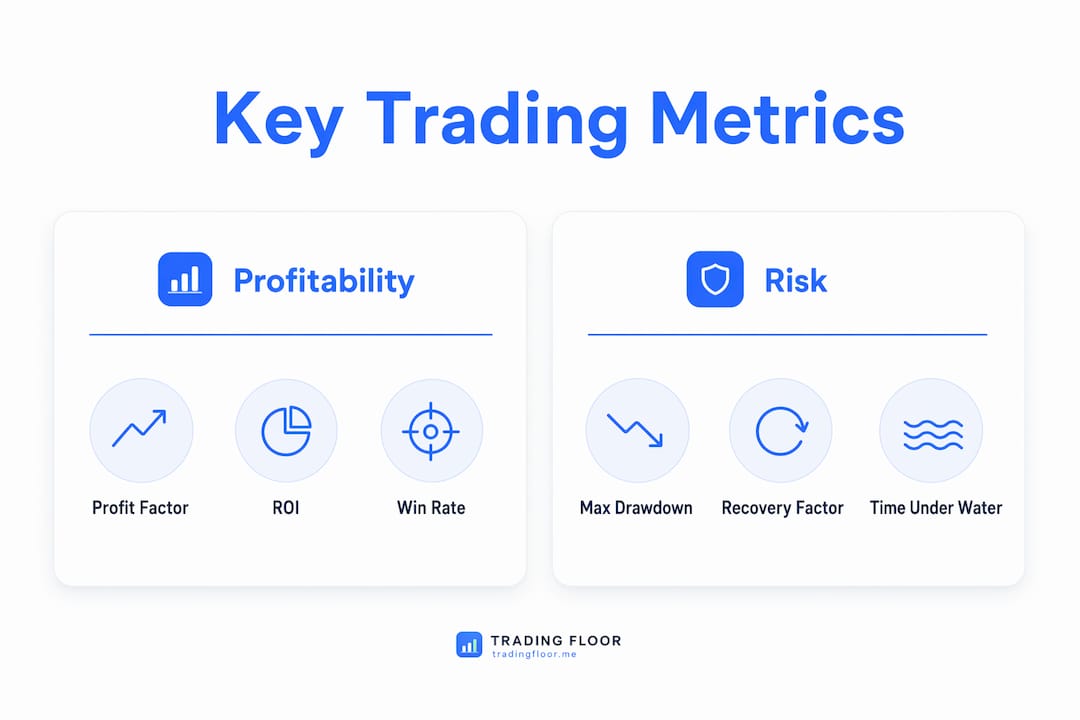
Net Profit and Return on Investment (ROI) measure absolute and percentage gains over a period. They are useful for comparing strategies across different account sizes, but they say nothing about the risk taken to generate those returns.
Win Rate is the percentage of trades that close profitably. Most traders treat it as the headline number, but it is actually a vanity metric. Systems with a lower win rate but a favorable reward-to-risk ratio consistently outperform systems with a high win rate and poor payoff ratio. A system winning 40% of trades but averaging $300 per winner and $100 per loser is far more profitable than one winning 70% with equal average win and loss sizes.
Expectancy solves this problem. It combines win rate and the average payoff ratio into a single number representing the average profit per trade. Expectancy accurately predicts average profit per trade by incorporating both hit rate and risk-reward balance, making it a superior edge indicator compared to raw win rate.
Pro Tip: Never evaluate win rate in isolation. Always pair it with average win size divided by average loss size. A 35% win rate with a 3:1 reward-to-risk ratio beats a 65% win rate with a 1:1 ratio every time.
Key profitability metrics at a glance:
- Profit Factor: Gross profit divided by gross loss; target above 1.5
- Net Profit/ROI: Total return in dollars or percentage; context-dependent benchmark
- Win Rate: Percentage of winning trades; meaningful only alongside payoff ratio
- Expectancy: Average profit per trade combining win rate and reward-to-risk ratio
How do risk metrics like maximum drawdown inform strategy evaluation?
Maximum Drawdown (MDD) measures the largest peak-to-trough decline in account equity during a given period. It is the single most important risk metric for any automated system because it defines the worst-case scenario a trader must psychologically and financially survive. A strategy that returned 40% last year but had a 35% drawdown along the way is not a 40% strategy. It is a strategy that nearly wiped the account first.
Maximum Drawdown exceeding 10% for retail traders and 5% for professional prop traders signals excessive risk. Those thresholds exist because drawdown asymmetry makes recovery exponentially harder as losses grow. A 20% drawdown requires a 25% gain to recover. A 50% drawdown requires a 100% gain. That math is why drawdown management is critical to long-term sustainability.
Recovery Factor connects drawdown directly to profitability. A Recovery Factor above 2.0 means net profit is more than twice the maximum drawdown, signaling strong risk-adjusted performance. A Recovery Factor below 1.0 means the strategy has not yet earned back what it lost at its worst point.
Time under water measures how long a strategy spends below its previous equity high. A system that recovers quickly from drawdowns is far more sustainable than one that lingers in loss territory for months. Prop traders managing evaluation account rules face hard drawdown limits, making this metric especially critical.
| Metric | Benchmark | What it tells you |
|---|---|---|
| Maximum Drawdown | <10% retail, <5% prop | Worst-case capital loss from peak |
| Recovery Factor | >2.0 | Net profit relative to max drawdown |
| Time under water | Shorter is better | How long equity stays below prior high |
| Drawdown duration | Strategy-dependent | Resilience and recovery speed |
Pro Tip: Track your psychological tolerance for drawdown separately from your financial tolerance. Many traders can afford a 15% drawdown mathematically but abandon the strategy at 8% due to stress. Know your real threshold before you go live.
What role do Sharpe and Sortino ratios play in performance analysis?
Risk-adjusted return metrics answer a question that raw profit cannot: how much risk did you take to earn that return? The Sharpe Ratio divides excess return by total volatility. A Sharpe Ratio above 1.0 is generally acceptable, and above 2.0 is considered strong for most systematic strategies.
The Sharpe Ratio has a well-known flaw. It penalizes upside volatility the same as downside volatility. A strategy that occasionally produces large winning trades gets punished by the Sharpe calculation even though those big wins are exactly what you want. Sharpe Ratio is widely used but often misused. The Sortino Ratio corrects this by measuring only downside deviation, making it a more accurate tool for high-volatility instruments like futures and options.
The Calmar Ratio and MAR Ratio both link annualized return directly to maximum drawdown. Risk-adjusted efficiency metrics like Calmar and MAR are critical in futures trading because they directly connect returns to worst-case capital loss. A Calmar Ratio above 1.0 means the strategy earns at least as much annually as its worst historical drawdown.
Risk-adjusted metrics compared:
- Sharpe Ratio: Return divided by total volatility; penalizes all volatility equally
- Sortino Ratio: Return divided by downside volatility only; better for skewed return distributions
- Calmar Ratio: Annualized return divided by max drawdown; direct risk-to-reward link
- MAR Ratio: Similar to Calmar but calculated over the full track record period
Combining multiple metrics and examining their relationships produces far more reliable evaluation than any single ratio. A strategy with a high Sharpe but a low Calmar, for example, likely has one catastrophic drawdown hiding in its history.
Which trade quality metrics reveal what returns and risk scores miss?
Trade quality and operational metrics diagnose whether a system is functioning as designed, not just whether it is making money. These indicators catch problems before they show up in the profit and loss statement.
Rule Adherence Rate measures how consistently the system follows its defined trading rules. A Rule Adherence Rate above 85% predicts future strategy sustainability, while rates below 60% are critical red flags. Low adherence often signals execution problems, broker connectivity issues, or slippage that is silently degrading performance. Monitoring Rule Adherence Rate and drawdown duration together gives early warning of strategy fragility before PnL deterioration begins.
Trade count determines whether your metrics are statistically meaningful. Most professionals require a minimum of 100 trades before metrics become actionable. A 90% win rate over 10 trades is meaningless. The same win rate over 500 trades is a genuine signal. Traders reviewing hands-off trading systems should always check sample size before drawing any conclusions from reported metrics.
Average win size and average loss size, expressed as a reward-to-risk ratio, confirm whether the strategy’s edge is real. A system with a 1:1 reward-to-risk ratio needs a win rate above 50% just to break even after costs. A system with a 3:1 ratio can be profitable winning only 30% of trades.
Live-versus-backtest drift is one of the most overlooked operational metrics. Live-vs-backtest performance drift identifies execution problems and market changes affecting real trading results. A strategy that performs well in backtesting but drifts significantly in live conditions usually suffers from overfitting, latency issues, or market regime changes.
| Metric | Target | Why it matters |
|---|---|---|
| Rule Adherence Rate | >85% | Confirms execution discipline and system integrity |
| Trade count | >100 trades | Validates statistical reliability of all other metrics |
| Reward-to-risk ratio | Strategy-dependent | Confirms edge exists independent of win rate |
| Live-vs-backtest drift | Minimal | Flags overfitting, latency, or regime changes |
Key Takeaways
Effective automated trading evaluation requires combining profitability, risk, risk-adjusted return, and trade quality metrics into a single hierarchical framework rather than relying on any one number.
| Point | Details |
|---|---|
| Profit Factor sets the baseline | Target above 1.5; anything below 1.0 means the system loses money regardless of win rate. |
| Drawdown defines survivability | Maximum Drawdown above 10% for retail traders signals excessive risk and threatens account longevity. |
| Sortino beats Sharpe for volatile systems | Sortino Ratio measures only downside volatility, giving a more accurate picture for futures and options strategies. |
| Trade count validates all other metrics | Fewer than 100 trades makes every metric statistically unreliable and potentially misleading. |
| Rule Adherence Rate is an early warning signal | Rates below 60% flag execution problems before they appear in profit and loss figures. |
Why I stopped trusting any single metric after one painful lesson
The first automated system I ran looked incredible on paper. Win rate above 60%, solid net profit, and a Sharpe Ratio that made it look like a machine printing money. What I missed was the Recovery Factor sitting at 0.8 and a Rule Adherence Rate that had quietly dropped to 55% over three weeks. The system was drifting. By the time the PnL showed the damage, the drawdown had already hit a level that triggered a funded account breach.
That experience taught me to evaluate metrics hierarchically, starting with operational health, then risk gating, then capital efficiency, and finally PnL quality. Most traders do it backward. They look at returns first and only check risk metrics when something goes wrong. That sequence guarantees you will always be reacting instead of anticipating.
The psychological side of drawdowns is also underestimated. Knowing your maximum drawdown is 12% on paper does not prepare you for watching your account drop 8% in two days. I now set a personal intervention threshold well below the system’s historical max drawdown. If the system hits that threshold, I review the Rule Adherence Rate and live-versus-backtest drift before making any changes. Most of the time, the system is fine and I am the problem.
My advice: build a performance review routine around all four metric categories, not just the ones that feel good to look at. The metrics you ignore are always the ones that eventually cost you.
— KennyTrades
How Tradingfloor supports real-time performance monitoring
Tracking automated trading metrics across multiple accounts is where most traders lose visibility. Tradingfloor mirrors real-time positions across funded and evaluation accounts simultaneously, giving you a single view of how your strategy performs under different risk parameters.
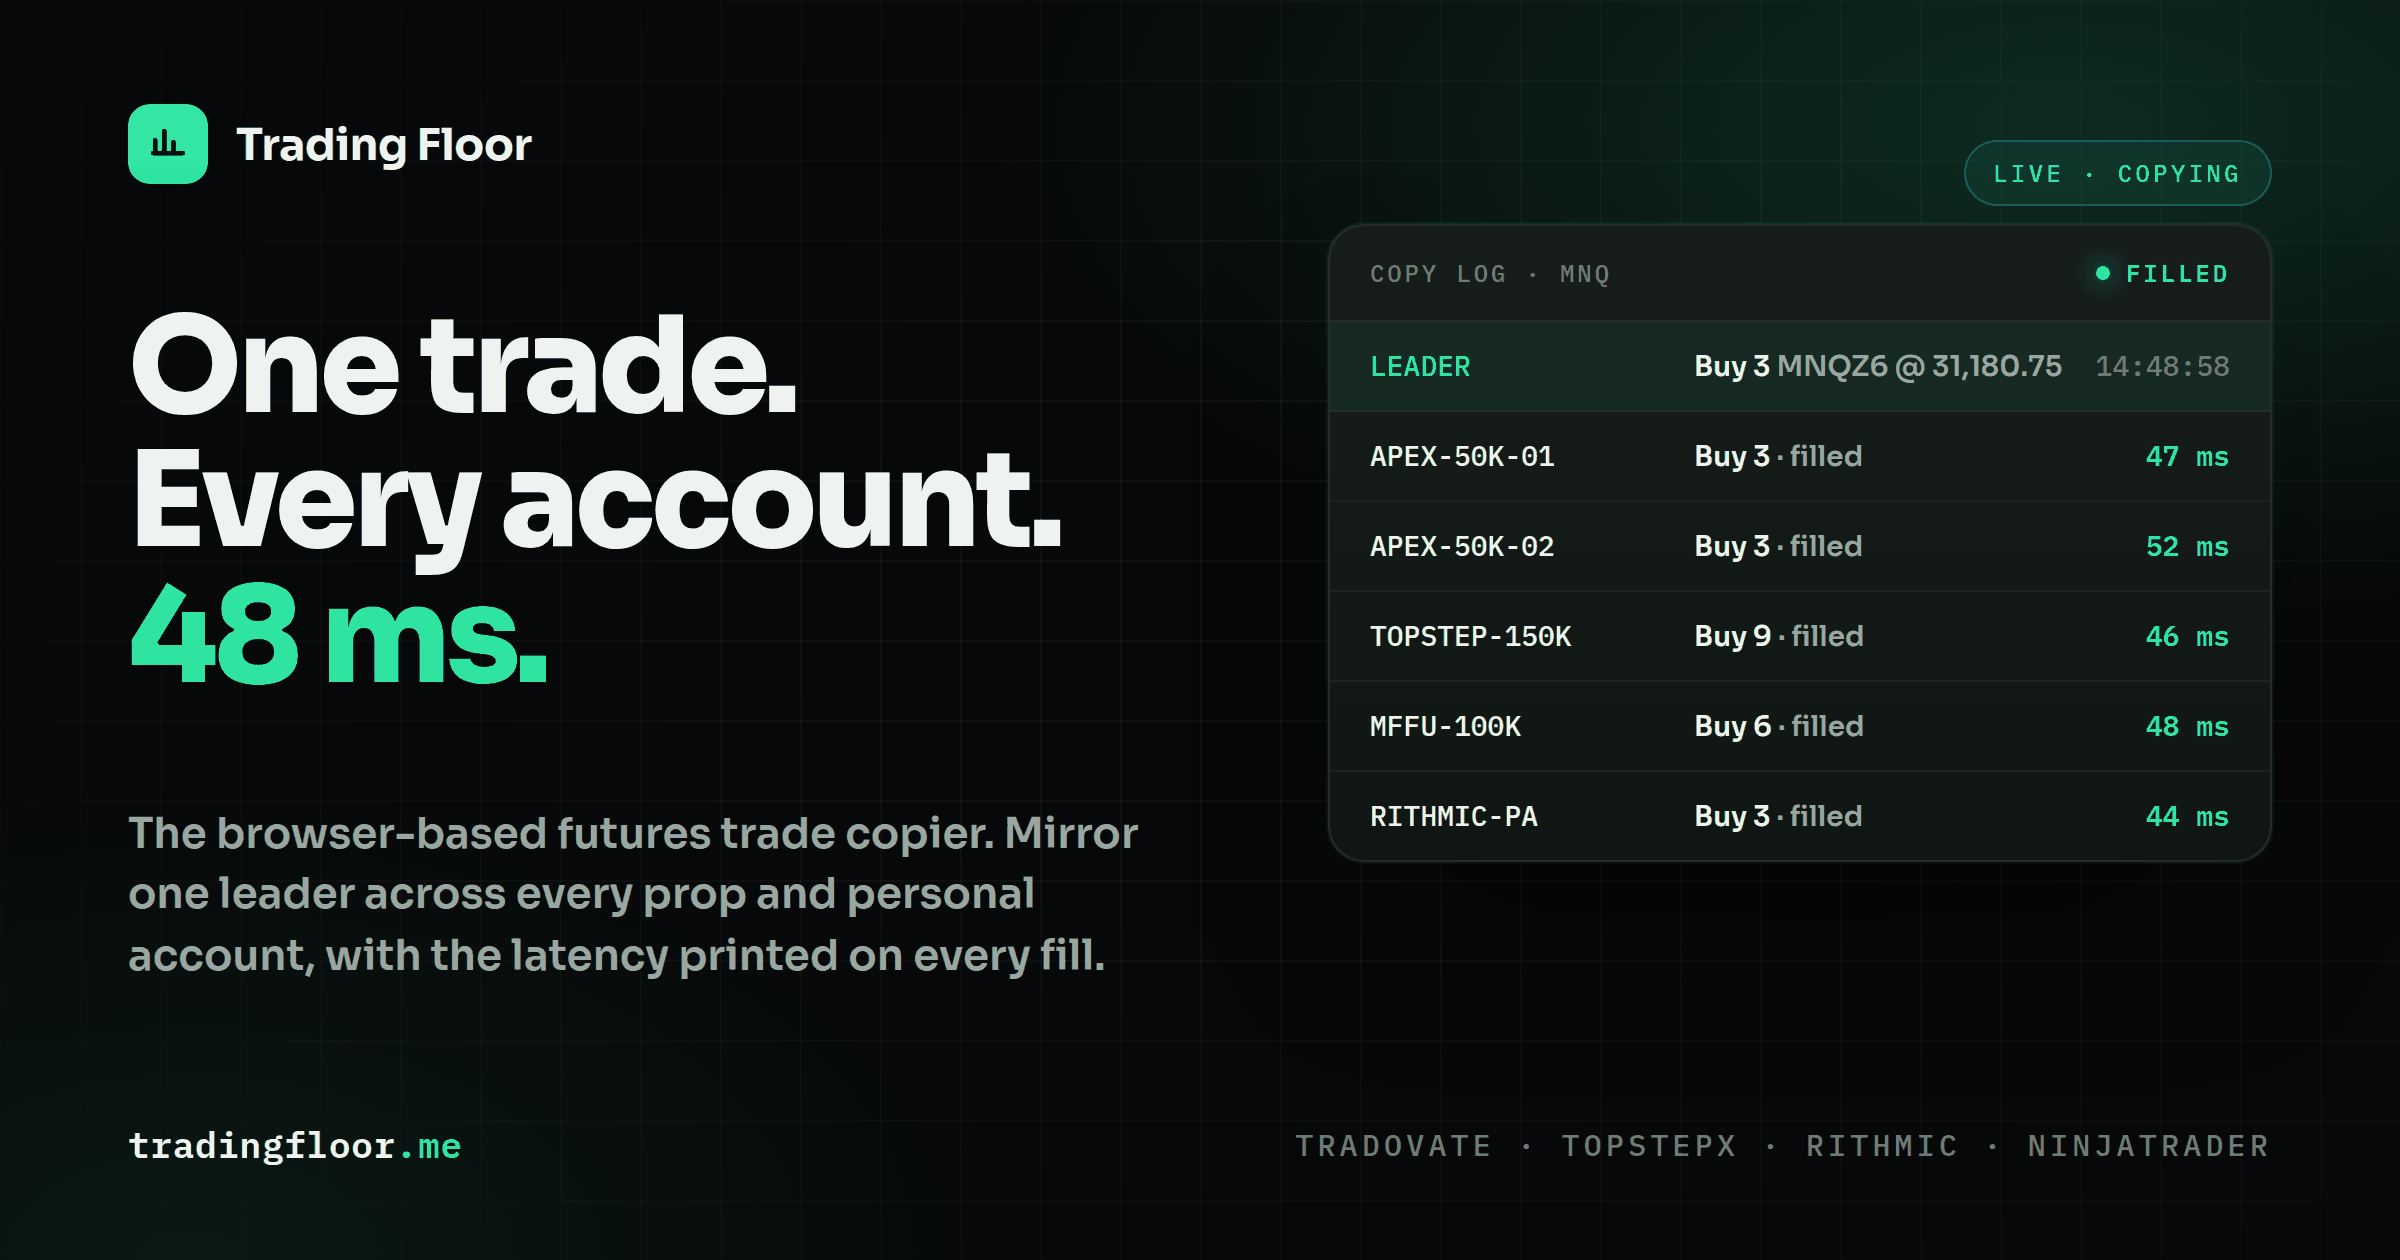
Tradingfloor’s cloud-based platform works across Tradovate and TopstepX without requiring any installation. Real-time notifications and trade limit controls mean you catch execution drift and drawdown breaches the moment they happen, not after the damage is done. Check the system status page for live performance dashboards and uptime monitoring. For traders managing multiple prop accounts, Tradingfloor’s pricing plans are built around the scale and control that serious automated trading demands.
FAQ
What is a good Profit Factor for an automated trading system?
A Profit Factor above 1.5 indicates a solid strategy. Anything below 1.0 means the system is losing money regardless of how often it wins.
How many trades do I need before my metrics are reliable?
Most professionals require a minimum of 100 trades before any metric becomes statistically actionable. Fewer trades make win rate, expectancy, and drawdown figures unreliable.
What is the difference between Sharpe Ratio and Sortino Ratio?
The Sharpe Ratio penalizes all volatility equally, including upside. The Sortino Ratio measures only downside volatility, making it more accurate for strategies with asymmetric return distributions.
What does live-vs-backtest drift mean for trading bots?
Live-versus-backtest drift measures how much a bot’s real performance deviates from its backtested results. Significant drift usually signals overfitting, latency problems, or a change in market conditions.
Why is Rule Adherence Rate important for automated strategies?
Rule Adherence Rate above 85% predicts strategy sustainability. Rates below 60% signal execution problems that will eventually show up as PnL losses if left unchecked.
Recommended
- Trading Performance Review: A Complete 2026 Guide — Trading Floor
- Automate Trades During Account Evaluation: A Prop Trader’s Guide — Trading Floor
- Prop Trader Performance Optimization Explained — Trading Floor
- Examples of Hands-Off Trading Systems That Work — Trading Floor
Trading Floor mirrors every trade across your Tradovate, TopstepX & Rithmic accounts in real time, from $25/mo.
Start copying →