Execution Speed in Auto-Trading: What Traders Must Know

Execution speed in auto-trading is the time between when your system submits an order and when that order receives a confirmed fill. If you’re running any automated strategy, here’s where to start:
- Who should care most: Scalpers, intraday algo traders, and anyone copying trades across multiple accounts in real time.
- The easiest test you can run today: Timestamp your API order submissions and compare them against broker fill confirmations. The gap is your baseline time-to-fill.
- The first low-cost fix: Move your automation to a VPS in the same geographic region as your broker’s servers.
A decision guide later in this article tells you exactly when to invest in speed upgrades versus when to simplify your strategy instead.
Key Takeaways
Execution speed in auto-trading is measurable, fixable, and only worth chasing when your strategy’s holding period is close enough to your observed latency that the gap actually costs you money.
| Point | Details |
|---|---|
| Speed vs. latency vs. slippage | These are three distinct metrics; confusing them leads to fixing the wrong problem. |
| Measure before you optimize | Capture p95 round-trip time and average slippage per trade before changing anything else. |
| VPS is the first low-cost fix | A VPS in your broker’s region typically cuts round-trip latency by 30–80 ms at low cost. |
| Run the monthly math | Monthly slippage cost versus infrastructure upgrade cost determines whether speed investment pays. |
| Tradingfloor for multi-account fills | Real-time position mirroring with per-account slippage caps solves cross-account execution drift. |
Table of Contents
- What is execution speed in auto-trading, and how does it differ from latency?
- How do you measure execution speed? The KPIs that actually matter
- Where do delays actually happen in the execution pipeline?
- How execution speed changes outcomes across different strategy types
- A practical checklist to improve your auto-trading execution speed
- How to run tests and monitor execution speed in production
- What are the real costs and risks of chasing execution speed?
- Should you prioritize execution speed? A short decision guide
- When does latency outweigh strategy? What the evidence says
- The part most traders get backwards
- Tradingfloor solves the multi-account execution problem directly
- Sources
What is execution speed in auto-trading, and how does it differ from latency?
These three terms get tangled constantly, and the confusion costs traders real money.
Execution speed is time-to-fill: the elapsed time from order submission to a confirmed fill at the exchange. Latency is broader. It covers two distinct delays: market-data latency (how long it takes price quotes to reach your system) and transmission latency (how long your order takes to travel from your machine to the broker and back). Slippage is the price difference between what your system intended to pay and what it actually paid.
They connect like this: high latency means your system is reacting to stale data and sending orders late. That late order arrives when the price has already moved, producing slippage. Execution speed and latency are distinct components — execution speed equals fill quality, while latency covers data and transmission delays — and both affect different strategy classes.
For retail traders, typical round-trip latency runs in the range of tens to a few hundred milliseconds depending on geography, broker infrastructure, and network quality. Institutional co-located systems operate in microseconds. That gap matters enormously for some strategies and almost not at all for others.
How do you measure execution speed? The KPIs that actually matter
Measuring execution speed without a framework produces noise. These are the metrics worth tracking, and how to capture them.
| Metric | How to measure | Unit | “Good” for latency-sensitive strategies |
|---|---|---|---|
| Round-trip time (RTT) | Timestamp API ping; compare send vs. receive | Milliseconds | A low latency time for intraday algos |
| Time-to-fill | Timestamp order send; compare to fill confirmation | Milliseconds | A low latency time for retail automation |
| Time-to-acknowledge | Timestamp order send; compare to broker ACK | Milliseconds | Under 30 ms for active scalping |
| Slippage | Intended price minus actual fill price | Ticks or dollars | Near zero; strategy-dependent |
| Fill rate | Filled orders divided by submitted orders | Percentage | A high fill rate in normal conditions |
| Rejection rate | Rejected orders divided by submitted orders | Percentage | A low rejection rate outside news events |
| Partial-fill rate | Partially filled orders divided by submitted | Percentage | A low partial-fill rate for liquid instruments |
Capturing these metrics requires client-side timestamping. Your automation platform should log a timestamp the moment it sends an API call, and a second timestamp when it receives the broker’s fill or ACK response. Broker-side timestamps exist but often reflect internal processing time, not the full round trip. The delta between your client timestamps is the number you actually control.
Common pitfalls: using system clock time without synchronizing to NTP (Network Time Protocol), logging only at the strategy level rather than the API call level, and ignoring partial fills when calculating average fill rate. For a deeper look at automated trading performance metrics, the full KPI framework is worth reviewing before you build your monitoring stack.
Where do delays actually happen in the execution pipeline?
Every order travels a specific path from your system’s decision to a confirmed fill. Delays accumulate at each step, and knowing which step is slowest tells you exactly where to focus.
- Decision layer: Your strategy logic fires. Computational complexity here adds microseconds to milliseconds depending on the calculation.
- Automation platform: The signal passes through your trading platform or custom code. Poorly optimized loops, garbage collection pauses (common in Python and Java), or overloaded machines add latency here.
- API call: Your order leaves your machine over the internet. Network hops, packet loss, and geographic distance all contribute. A trader in Chicago connecting to a New York-based broker adds round-trip network latency that a co-located system avoids entirely.
- Broker validation and risk checks: The broker’s system validates margin, position limits, and account status before routing. This step is non-negotiable but varies by broker from under 1 ms to tens of milliseconds.
- Order router: The broker routes your order to the appropriate venue. Smart order routing (SOR) adds a small overhead but often improves fill quality.
- Exchange matching engine: Your order enters the queue. During high-volume periods (market open, economic releases), queue depth increases and fill times lengthen.
- Fill confirmation and client ACK: The exchange confirms the fill, the broker relays it, and your system receives the acknowledgment. Network latency on the return path mirrors the outbound trip.
The broader adoption of AI and automation across markets has increased the speed at which prices respond to new information, raising the stakes at every step of this pipeline for strategies that depend on reacting quickly.
Pro Tip: To isolate your biggest bottleneck, run a controlled experiment: send a timestamped dummy order (or API ping) during off-hours and compare the time-to-ACK against your production time-to-fill during active sessions. The difference between those two numbers points directly at either broker-side processing or exchange queue depth as your primary delay source.
How execution speed changes outcomes across different strategy types
Not every automated strategy cares about milliseconds equally. The relationship between your trading horizon and your observed latency determines how much speed actually matters.

High-frequency trading and scalping operate on holding periods measured in seconds or less. When your strategy’s expected edge exists in a price window that closes in 50 milliseconds, a 100-millisecond round-trip latency means you’re consistently arriving after the opportunity is gone. Speed here is not a nice feature; it’s the entire premise.
Algorithmic execution strategies like VWAP and TWAP spread orders across time windows measured in minutes or hours. A 200-millisecond latency is essentially invisible against a 30-minute execution window. These strategies care far more about fill quality, market impact, and avoiding information leakage than about raw speed.
Short-term systematic intraday strategies sit in the middle. A strategy holding positions for 5–15 minutes can tolerate 100–300 ms latency without meaningful edge erosion, but slippage on entry and exit still compounds across many trades. Here, consistency matters more than peak speed.
Swing and position strategies are largely latency-tolerant. A trader holding for days or weeks loses nothing meaningful to a 500-millisecond fill delay.
The sensitivity rule is straightforward: when your trading horizon approaches your observed latency window, speed becomes a determinative factor. For most retail automation, execution operates in tens to hundreds of milliseconds, and stability, multi-leg handling, and consistent fills usually matter more than shaving a few milliseconds.
Slippage sensitivity example: A scalping strategy targeting a 2-tick edge on ES futures that experiences consistent 1-tick slippage on entry and exit is losing its entire theoretical edge to execution costs alone, before commissions.
A practical checklist to improve your auto-trading execution speed
Work through these in order. The low-cost fixes often produce the biggest gains.
- Synchronize your system clock to NTP. Accurate timestamps are the foundation of every measurement. Without them, you’re measuring noise.
- Move automation off shared or overloaded machines. A strategy running on the same machine as a browser, antivirus scans, or other processes will see unpredictable latency spikes.
- Deploy a VPS in the same region as your broker’s servers. A VPS in Chicago for a Chicago-based broker can cut round-trip network latency by 30–80 ms compared to a home connection.
- Optimize order types for your strategy. Immediate-or-cancel (IOC) orders avoid partial-fill hangs. Limit orders reduce slippage but risk non-fills. Market orders guarantee fills but accept the spread. Match the order type to the strategy’s actual tolerance.
- Avoid thin liquidity windows. Submitting orders in the first and last minutes of a session, or immediately before major economic releases, amplifies queue depth and rejection rates.
- Choose brokers with documented API performance and smart order routing. Before committing, verify the broker’s regulatory standing using FINRA BrokerCheck and confirm SIPC membership for custodial protection. A fast API at an unreliable broker is a net negative.
- Use pre-signed or bracket orders where your platform supports them. Submitting contingent orders in advance removes the decision-to-submission step from the live latency path.
- Implement retry logic with intelligent limit pricing. A rejected order that retries with a slightly adjusted limit price recovers faster than one that waits for a new signal cycle.
- Batch or debounce automated signals during high-frequency bursts. Sending 20 orders in 50 milliseconds can trigger broker-side rate limiting. Controlled batching keeps throughput stable.
- Consider co-located or direct market access (DMA) connectivity only after exhausting steps 1–9. Co-location costs real money and adds operational complexity. It’s the right answer for a small subset of strategies.
Pro Tip: Before spending on infrastructure, calculate your monthly slippage cost in dollars (average slippage per trade × trade frequency × contract value). If that number is smaller than the infrastructure upgrade cost, the upgrade doesn’t pay for itself. Run the math first.
For practical architecture patterns that support stable automation, hands-off trading system examples show how consistent execution design reduces latency-related errors in production.
How to run tests and monitor execution speed in production
A one-time measurement tells you where you stand today. Ongoing monitoring tells you when something breaks.
The controlled round-trip test: During off-hours, send a series of timestamped API pings or dummy orders (check your broker’s sandbox environment). Record time-to-ACK for each. Then repeat during your live trading session and compare. The difference between off-hours ACK time and live-session fill time isolates exchange queue depth from network and broker processing delays.
What to store in your monitoring log:
Track rolling percentiles rather than averages. The p95 and p99 values reveal tail latency — the worst-case fills that happen during market stress. An average of 80 ms with a p99 of 1,200 ms means your system occasionally takes over a second to fill, which is a different problem than a consistently slow system.
These alerts catch broker-side degradation, network issues, and exchange congestion before they silently erode your P&L. Trading execution best practices covers alert configuration and dashboard design in more detail.
What are the real costs and risks of chasing execution speed?
Speed improvements carry direct costs, indirect costs, and a category of risk most traders underestimate.
Direct costs include premium API tiers, co-location fees at exchanges like CME Group, and specialist brokers who charge more for lower-latency connectivity. These are real line items that need to appear in your strategy’s cost model.
Indirect costs are subtler. Larger order sizes sent faster can increase market impact, moving the price against you before your fill completes. More complex infrastructure introduces more failure points. A system optimized for microsecond performance is often brittle in ways a simpler system is not.
The “optimizing to the test” trap is the most dangerous risk. Traders tune their systems to perform well on synthetic latency benchmarks, then discover that real-market conditions (news events, exchange outages, broker maintenance windows) expose failure modes the benchmark never tested. Faster is not always more resilient.
Speed investments are likely to reduce P&L when: your strategy’s holding period is measured in minutes or longer, your average slippage is already below 0.5 ticks, or your infrastructure cost exceeds your measured monthly slippage loss. For common pitfalls that amplify these risks in multi-account setups, automated investing mistakes is worth reading before scaling.

Should you prioritize execution speed? A short decision guide
Work through these four questions before spending time or money on speed improvements.
- Trading horizon vs. observed latency: Is your average holding period within 10x of your observed p95 RTT? If yes, speed is a factor. If your holding period is 10 minutes and your p95 RTT is 150 ms, speed is not your constraint.
- Slippage vs. strategy edge: Calculate average slippage per trade in dollars. If slippage exceeds 20% of your average expected profit per trade, execution quality is eroding your edge and deserves attention.
- Order frequency: High-frequency strategies (dozens of orders per session) multiply slippage costs. A 0.5-tick average slippage on 100 trades per day in ES futures is a meaningful monthly number. A 0.5-tick slippage on 3 trades per week is not.
- Multi-leg complexity: Strategies that require simultaneous fills across multiple legs or accounts face compounded execution risk. Each additional leg adds a potential delay and a potential partial-fill.
Back-of-envelope calculation: Average slippage per trade (in dollars) × daily trade count × 22 trading days = monthly slippage cost. Compare that number against the monthly cost of your proposed infrastructure upgrade. If the upgrade costs more than it saves, fix the strategy logic instead.
Action thresholds: If monthly slippage cost exceeds $200 and your strategy runs intraday, a quality VPS upgrade is almost always worth it. If monthly slippage cost exceeds $1,000 and your strategy holds positions for under 5 minutes, broker API selection and order-type optimization deserve immediate attention. For prop traders managing multiple accounts, multi-platform trading best practices addresses the synchronization dimension of this calculation.
When does latency outweigh strategy? What the evidence says
The structural argument is clear: latency acts like a strategy tax. When market prices move faster than your system can observe, decide, and act, adding strategy complexity doesn’t help. You’re not losing because your signal is wrong; you’re losing because you’re always acting on yesterday’s price.
This framing matters because most traders respond to poor performance by refining their signal logic. They add filters, adjust parameters, and backtest new entry conditions. But if the underlying problem is that their fills are arriving 300 milliseconds after the signal fired, no amount of signal refinement fixes it. The edge existed; the execution consumed it.
The practical recommendation: measure your execution pipeline before you touch your strategy logic. If your time-to-fill is consistently exceeding your strategy’s signal window, fix the infrastructure first. If your fills are arriving within a reasonable window and you’re still losing, then the signal deserves scrutiny.
The part most traders get backwards
The instinct when performance degrades is to make the strategy smarter. Add a new indicator. Tighten the entry filter. Adjust the exit logic. That instinct is wrong roughly half the time.
Execution problems masquerade as strategy problems constantly. A strategy that backtests well but underperforms live is often suffering from slippage and fill delays that the backtest assumed away. The backtest filled at the signal price; the live system filled 150 milliseconds later at a worse price, every single time.
The traders who figure this out fastest are the ones who instrument their systems before they optimize them. They know their p95 RTT. They know their average slippage per trade. They know their rejection rate during the market open. With those numbers in hand, the question of whether to fix execution or fix strategy has a clear, data-driven answer.
Speed for its own sake is a trap. Speed as a measured response to a measured problem is how you actually improve a system.
Tradingfloor solves the multi-account execution problem directly
For traders whose execution delays stem from copying positions across multiple funded or evaluation accounts, the bottleneck isn’t the broker API or the network. It’s the manual or semi-manual process of replicating fills across accounts in real time.
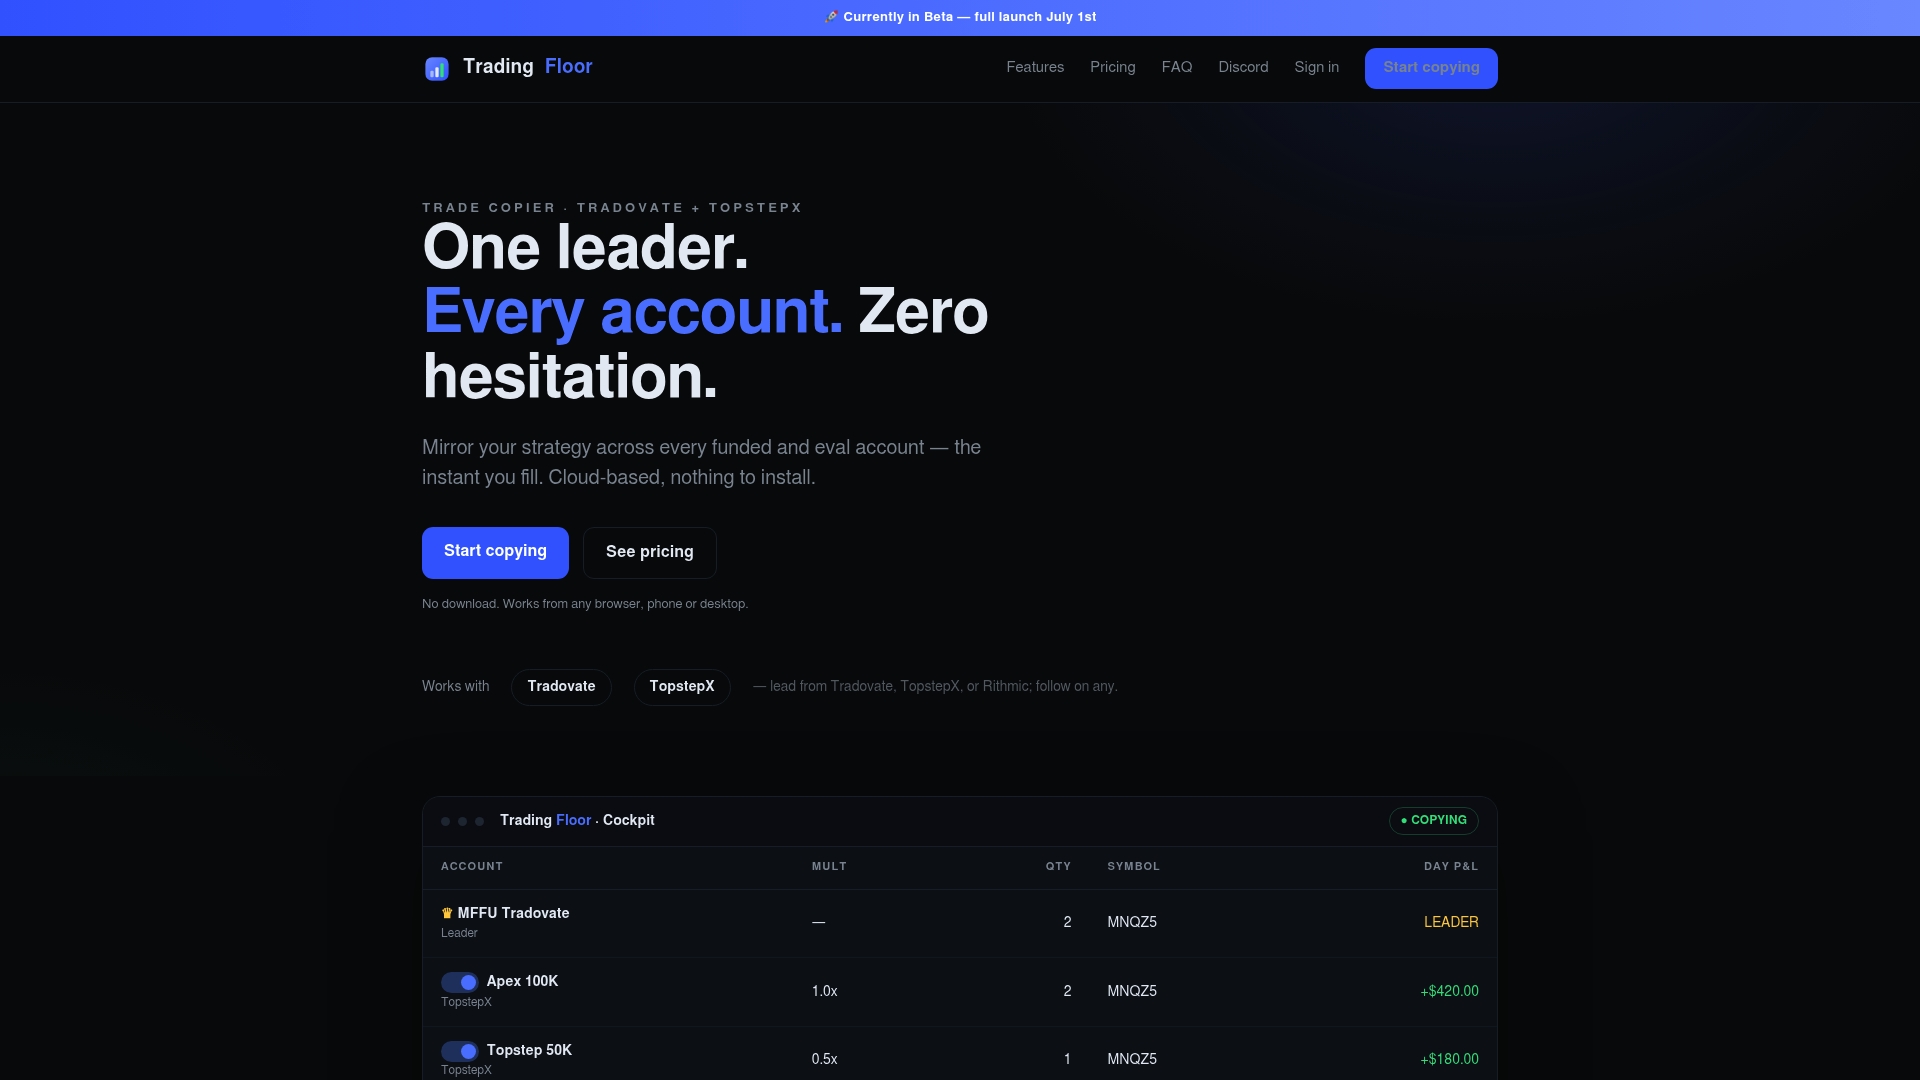
Tradingfloor mirrors your net position across every connected account the moment a fill occurs, with per-account slippage caps that prevent runaway fills on any single account. Push notifications confirm each copy in real time, and automatic reconciliation catches any drift between the leader account and followers without manual intervention. It runs entirely in the cloud, so there’s nothing to install and no local machine to keep online.
For prop traders managing Tradovate, TopstepX, or Rithmic accounts simultaneously, this is the execution consistency problem solved at the infrastructure level rather than patched manually. Start with a 30-day free trial and see how consistent fills across accounts change your performance numbers.
Sources
- Broker API Secrets: How Smarter Execution Beats Faster Bots
- Latency, Liquidity, and Precision: The Real Value of Speed
- Lse
This article is general information, not a substitute for advice from a qualified financial advisor. Consult a qualified financial professional about your own circumstances before acting on anything here.
Recommended
- Trading Execution Best Practices: A 2026 Trader’s Guide — Trading Floor
- Automated Trading Performance Metrics: A Trader’s Guide — Trading Floor
- Examples of Hands-Off Trading Systems That Work — Trading Floor
- Automate Trades During Account Evaluation: A Prop Trader’s Guide — Trading Floor
Trading Floor mirrors every trade across your Tradovate, TopstepX & Rithmic accounts in real time, from $25/mo.
Start copying →