Trading Performance Review: A Complete 2026 Guide

A trading performance review is a structured, recurring process that analyzes aggregate trading data to uncover behavioral patterns and identify specific improvements. Most traders track profit and loss but never ask why they won or lost. That gap is exactly where performance reviews close the distance between guessing and growing. A proper review covers core metrics like win rate, profit factor, expectancy, and maximum drawdown, and runs on defined intervals: daily reflection (5–10 minutes), weekly analysis (30–60 minutes), and monthly assessment (1–2 hours).
What is a trading performance review and why does it matter?
A trading performance review is not the same as checking your P&L at the end of the day. It is a systematic examination of your trading activity across time, using quantitative metrics and behavioral observations to find patterns you cannot see trade by trade. Think of it as the difference between reading one sentence and reading the whole chapter. Individual trades tell you what happened. A performance review tells you what is actually going on.
The review process matters because profit and loss alone are insufficient for trading analysis. A trader can make money on a poorly executed trade and lose money on a perfectly executed one. Without a structured review, you reward the wrong behaviors and repeat the wrong decisions. The goal is to understand why money was made or lost, not just whether it was.

Prop traders face an additional layer of urgency. Maximum drawdown limits for prop trading typically sit below 5%, which means a few bad weeks without a review process can end a funded account. Structured reviews catch deteriorating patterns before they become account-ending events.
What are the key metrics in a trading performance review?
Five core trading performance metrics form the foundation of any serious review. Each one measures a different dimension of your strategy’s health.
Win rate measures how often your trades close profitably. The standard benchmark sits between 40% and 60%. A win rate below 40% is not automatically a problem if your winners are large, but it signals that your edge needs examination.
Profit factor divides gross profit by gross loss. A profit factor above 1.3 indicates a solid system. A profit factor below 1.0 over 50 or more trades signals a loss-making system. That threshold of 50 trades matters because smaller samples produce misleading numbers.
Expectancy calculates the average dollar amount you expect to make per trade. A positive expectancy confirms your strategy has an edge. A negative expectancy means you are losing money on average, regardless of how many winning trades you record.
Maximum drawdown measures the largest peak-to-trough decline in your account. Monitoring maximum drawdown during reviews helps traders maintain emotional discipline and stick with strategies during losing streaks. For prop traders, keeping drawdown below 5% is often a hard account rule.
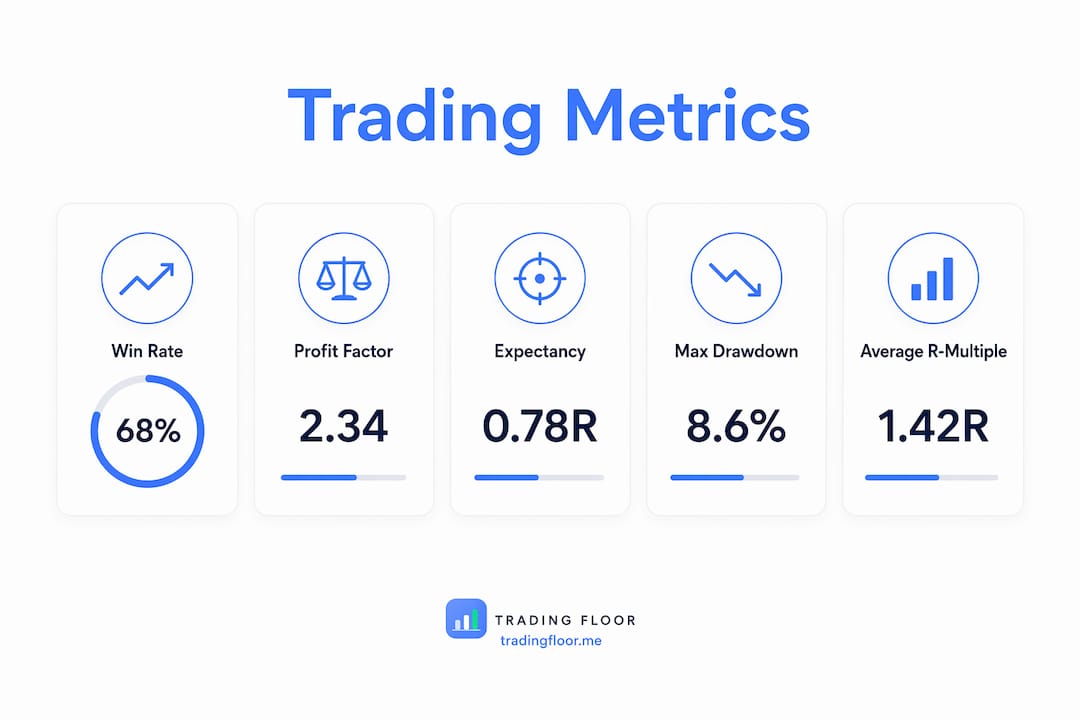
Average R-multiple compares your average winner to your initial risk per trade. An average R-multiple above 0.5R is considered strong. Below that, you are likely cutting winners too early or sizing positions poorly.
| Metric | Benchmark | What it reveals |
|---|---|---|
| Win rate | 40%–60% | How often your setups work |
| Profit factor | Above 1.3 | Overall system profitability |
| Expectancy | Positive | Average edge per trade |
| Maximum drawdown | Below 15% (below 5% for prop) | Risk exposure and emotional pressure |
| Average R-multiple | Above 0.5R | Exit quality and trade management |
No single metric tells the full story. A high win rate with a profit factor below 1.0 means your losers are too large. A strong profit factor with a low win rate means your strategy requires patience most traders do not have. The combined view reveals what individual numbers hide.
Pro Tip: Track your evaluation account rules alongside your personal metric benchmarks. Prop firm thresholds and your own risk limits should inform each other.
How to conduct structured reviews at different intervals
Consistency is the defining trait of traders who improve. Highest-performing traders run reviews whether they are profitable or not. Waiting for a losing streak to start reviewing is the most common and most costly mistake in the process.
Three review intervals cover the full picture:
-
Daily review (5–10 minutes). Immediately after the session, record your emotional state, whether you followed your rules, and any setups you deviated from. Do not analyze statistics at this stage. The goal is to capture raw, honest observations before memory distorts them. Ask: “Did I trade my plan?” not “Did I make money?”
-
Weekly review (30–60 minutes). Pull your metrics for the week and compare them to your benchmarks. Score each trade’s execution quality on a 1–10 scale, separate from whether it was profitable. Look for time-of-day patterns, setup-specific win rates, and any rule violations that appeared more than once. This is where trading performance analysis shifts from data collection to interpretation.
-
Monthly assessment (1–2 hours). Step back from weekly noise and examine your strategy’s overall trajectory. Are your core metrics trending up or down over four weeks? Have market conditions shifted in a way that affects your edge? Set one specific behavioral commitment for the next month based on what the data shows.
Pro Tip: Schedule your weekly review for the same day and time each week. Traders who treat the review as a fixed appointment complete it far more consistently than those who fit it in when convenient.
The consistency of reviews matters more than their depth at first. A 30-minute weekly review done every week beats a four-hour quarterly deep-dive done twice a year.
Common pitfalls in trading performance analysis
The most widespread mistake in trading results evaluation is confusing a trade review with a performance review. A trade review focuses on individual execution quality and rule adherence. A performance review examines aggregate statistical patterns and strategy effectiveness over time. Both are necessary, but they answer different questions.
Outcome bias is the second major trap. Traders who focus only on P&L end up reinforcing lucky trades and dismissing well-executed losers. The fix is direct: score execution quality independently of the result. A trade that followed your rules perfectly but lost money is a 9/10 execution. A trade that broke your rules but happened to profit is a 2/10 execution. That scoring discipline keeps your review honest.
Passive journaling is a historical archive. Active self-analysis interrogates data with specific questions, such as whether your win rate drops after 11:00 AM or whether your largest losses cluster around news events. The difference between the two is the difference between a diary and a diagnostic tool.
Narrative storytelling is another pitfall. Traders write long explanations for why a bad trade “made sense at the time.” Those explanations protect the ego and obscure the pattern. Replace narratives with data. Instead of writing “the market was unpredictable,” record the setup type, entry time, and execution score. Patterns emerge from structured data, not from stories.
Monitoring behavioral trading patterns across your review history reveals whether problems are random or systemic. Random errors are noise. Systemic errors are fixable.
How to apply review insights to improve your strategy
A review that produces no change in behavior is just record-keeping. The goal is to convert findings into specific, measurable adjustments.
The most direct application is doubling down on what works. If your review shows that one specific setup generates 80% of your profits, trade it more and trade it better. Cut the setups that drain your account even when they occasionally win. Proper analysis finds why money was made or lost and uses that to improve future decisions, not just to explain past ones.
Tracking R:R realization is one of the most underused techniques in performance reviews. This means comparing your planned risk-reward ratio to your actual realized ratio on each trade. Discrepancies between planned and realized risk-reward reveal whether you are cutting winners too early or holding losers too long. Both are execution problems, not strategy problems, and both are fixable once you can see them in the data.
Set one behavioral commitment per week based on your review findings. Not five. One. “I will not trade after 12:00 PM” or “I will not add to a losing position” are specific enough to measure. Vague commitments like “I will be more disciplined” produce no change.
Use your maximum drawdown data to manage psychological pressure. When drawdown approaches your personal limit, recovering from a drawdown hit requires both tactical and mental adjustments. Reviews that track drawdown trends give you early warning before the pressure becomes acute.
Pro Tip: Compare your pre-trade plan to your actual execution metrics each week. The gap between what you planned and what you did is where most performance improvements live.
Digital tracking tools and structured journals make this process faster and more consistent. The format matters less than the habit. A spreadsheet you use every week beats a sophisticated platform you open once a month.
Key Takeaways
A trading performance review works because it separates process quality from trade outcomes, giving traders a factual basis for improvement rather than a reaction to results.
| Point | Details |
|---|---|
| Define the review correctly | A performance review analyzes aggregate patterns, not individual trades. |
| Track five core metrics | Win rate, profit factor, expectancy, max drawdown, and average R-multiple give a complete picture. |
| Use three review intervals | Daily (5–10 min), weekly (30–60 min), and monthly (1–2 hours) cover different layers of analysis. |
| Eliminate outcome bias | Score execution quality on a 1–10 scale independent of whether the trade was profitable. |
| Convert findings to one commitment | Set one specific behavioral change per week based on what the data shows. |
Why I think most traders review the wrong thing
Most traders I have watched review their trades, not their performance. They replay entries and exits, argue with the chart about what “should have” happened, and close the session feeling like they learned something. They did not. They just rehearsed their opinions.
The shift that changed my own trading was separating process from outcome completely. A losing week with strong execution scores is progress. A winning week with poor execution scores is a warning. Once I started reading it that way, the emotional noise dropped significantly. I stopped celebrating lucky wins and stopped beating myself up over well-executed losses.
The hardest part is not the metrics. It is the honesty. Scoring your own trades at a 3/10 when you know you broke your rules, even on a trade that made money, requires a level of self-accountability most traders avoid. But that honesty is exactly what makes the review useful.
Start with the weekly review. Do it for four weeks before adding the monthly layer. The daily reflection takes five minutes and costs nothing. Gradual implementation beats a perfect system you abandon after two weeks.
— KennyTrades
How Tradingfloor supports your performance review process
Tradingfloor is built for prop traders who manage multiple accounts and need consistent execution across all of them. When your review reveals that execution errors are costing you, the problem is often not your strategy. It is the friction of managing positions manually across funded and evaluation accounts.
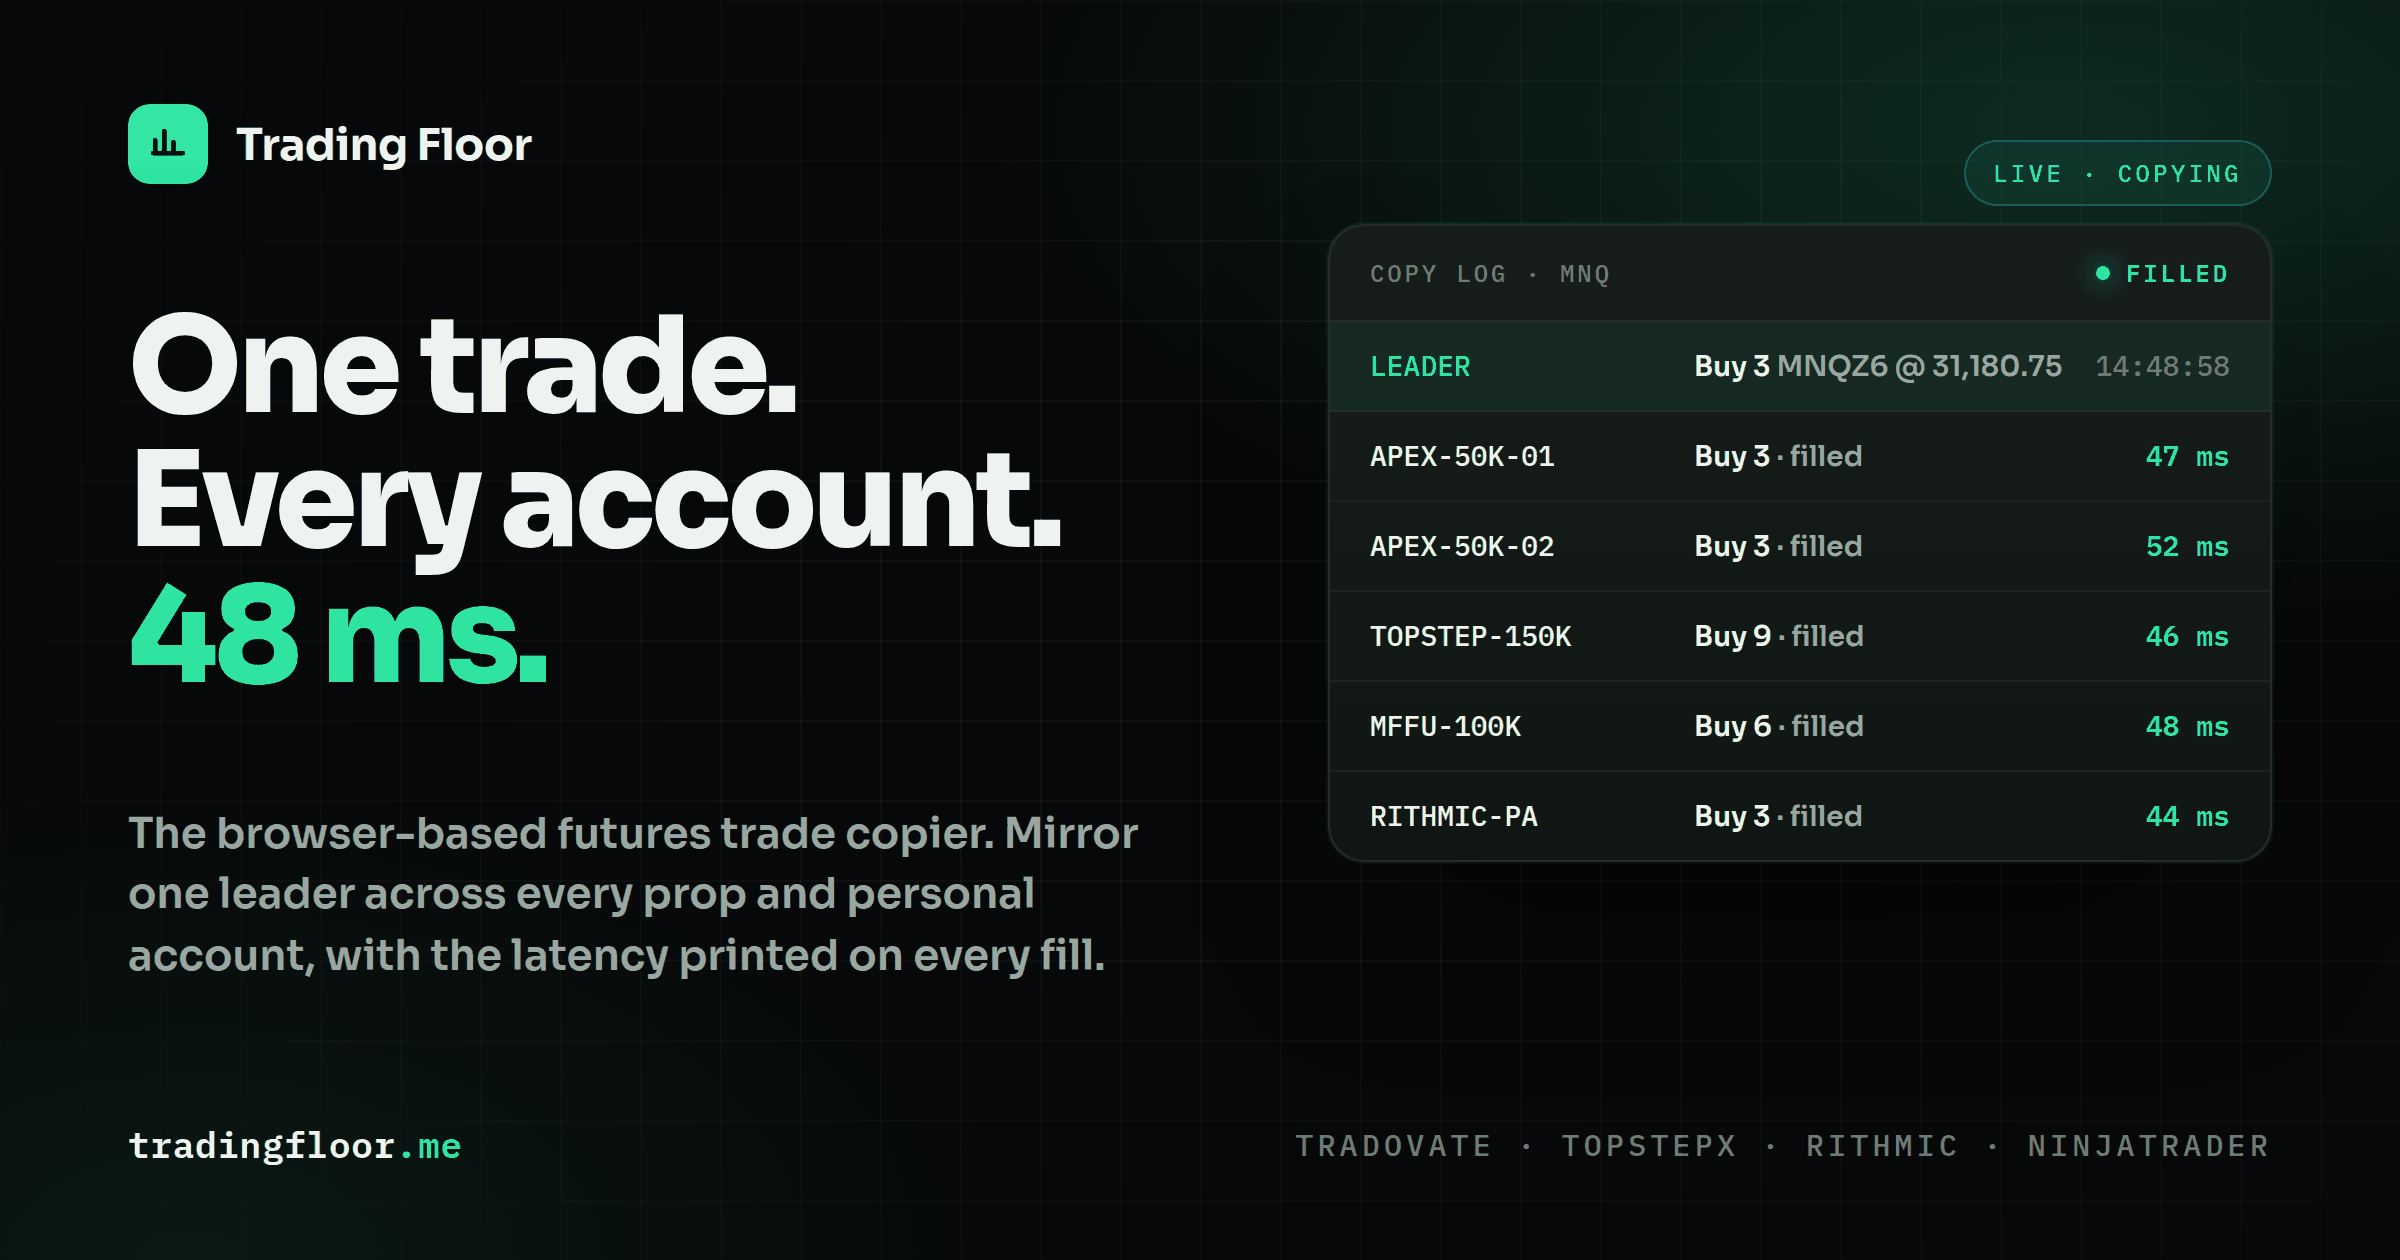
Tradingfloor mirrors your leader account’s net position across every connected account in real time, with individual risk controls on each one. That means your review findings translate directly into cleaner execution, not just better intentions. The platform works on Tradovate and TopstepX, runs from any device without installation, and sends real-time notifications so you stay aware of every position. Explore Tradingfloor’s plans and see how consistent execution supports the improvements your reviews identify.
FAQ
What is the difference between a trade review and a performance review?
A trade review examines individual execution quality and rule adherence on specific trades. A performance review analyzes aggregate statistical patterns across many trades to assess overall strategy effectiveness.
How often should I conduct a trading performance review?
The standard framework includes a daily reflection (5–10 minutes), a weekly analysis (30–60 minutes), and a monthly strategic assessment (1–2 hours). Consistency across all three intervals produces the clearest picture.
What metrics should I include in a trading review?
The five core metrics are win rate (benchmark: 40%–60%), profit factor (above 1.3), expectancy (positive), maximum drawdown (below 15%, or below 5% for prop accounts), and average R-multiple (above 0.5R).
How do I avoid outcome bias in my trading performance analysis?
Score each trade’s execution quality on a 1–10 scale based on rule adherence, independent of whether the trade was profitable. This keeps your review focused on decision quality rather than results.
What is the most common mistake traders make in performance reviews?
The most common mistake is passive journaling, which is recording trades without interrogating the data. Active self-analysis asks specific questions about patterns, such as time-of-day effects or setup-specific win rates, to find real improvements.
Recommended
- Prop Trader Performance Optimization Explained — Trading Floor
- Net Position Tracking in Trading: A 2026 Guide — Trading Floor
- Multi-Platform Trading Best Practices for Prop Traders — Trading Floor
- Types of Trade Copying Strategies: 2026 Guide — Trading Floor
Trading Floor mirrors every trade across your Tradovate, TopstepX & Rithmic accounts in real time, from $25/mo.
Start copying →